Reports: how the year is going
Four short reports off the invoices and quotes you've already sent: what you billed month by month, who you billed it to, how many quotes turned into work, and what VAT you carried. A Pro feature, or part of your first couple of weeks on ChatBill. Nothing here changes a document, so you can't break anything by clicking around.
-
1. Open Reports from your dashboard
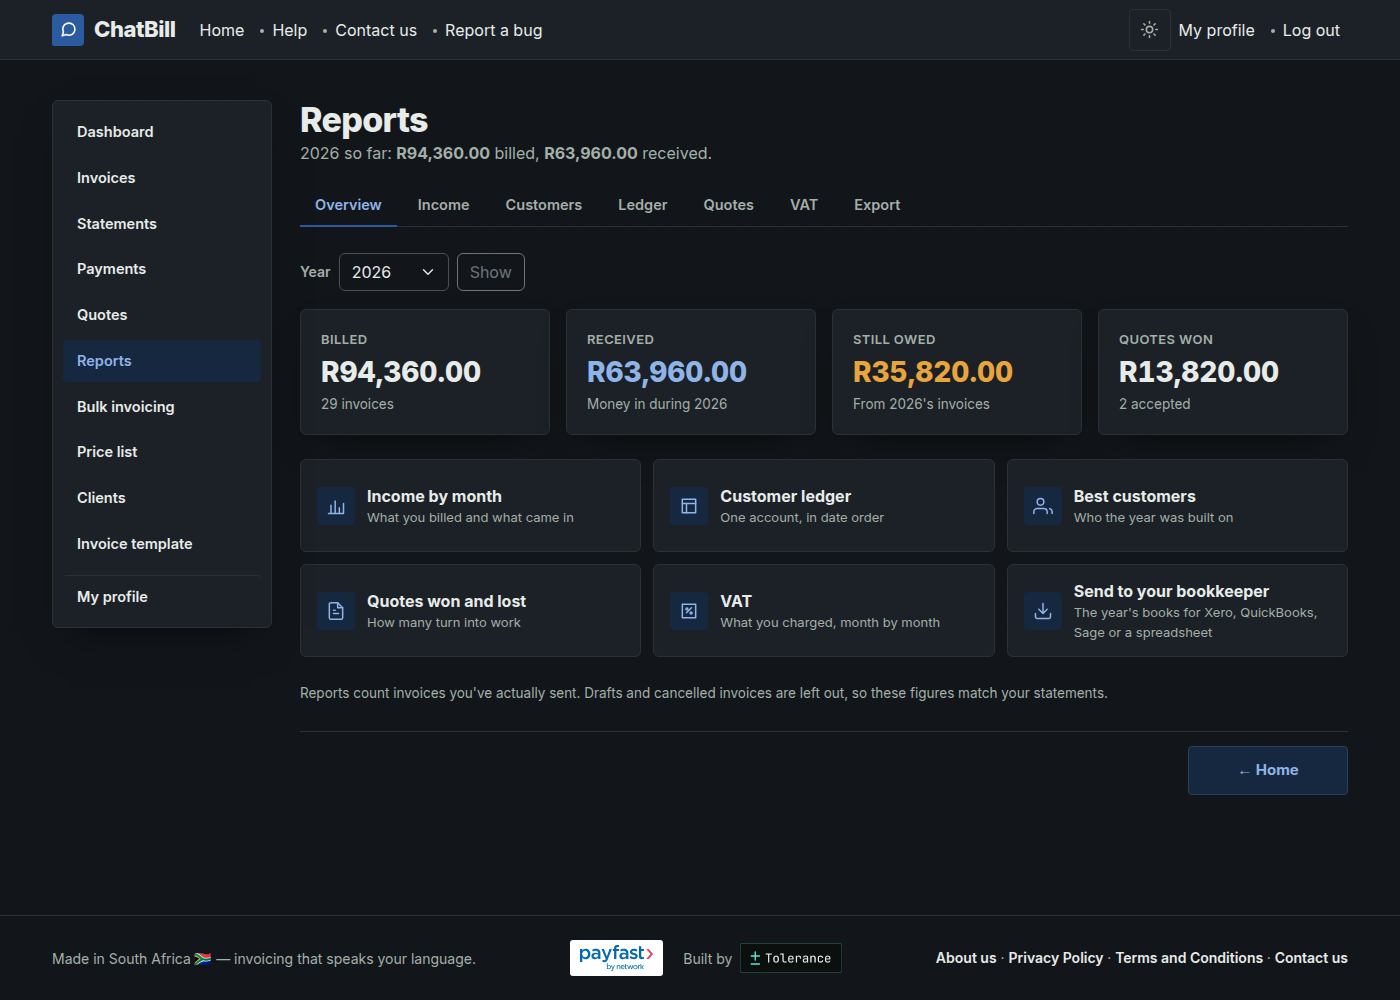
Reports sits in your dashboard's quick links, alongside Invoices and Quotes. The first page is the overview: what you've billed this year, what's actually come in, what's still owed, and the value of the quotes you've won.
The tabs across the top move between the reports, and the year picker beside them changes the year. Whichever year you're looking at stays picked as you move between tabs, so you can read a whole year through without setting it again each time. Only years you actually have documents in are offered.
-
2. Income by month
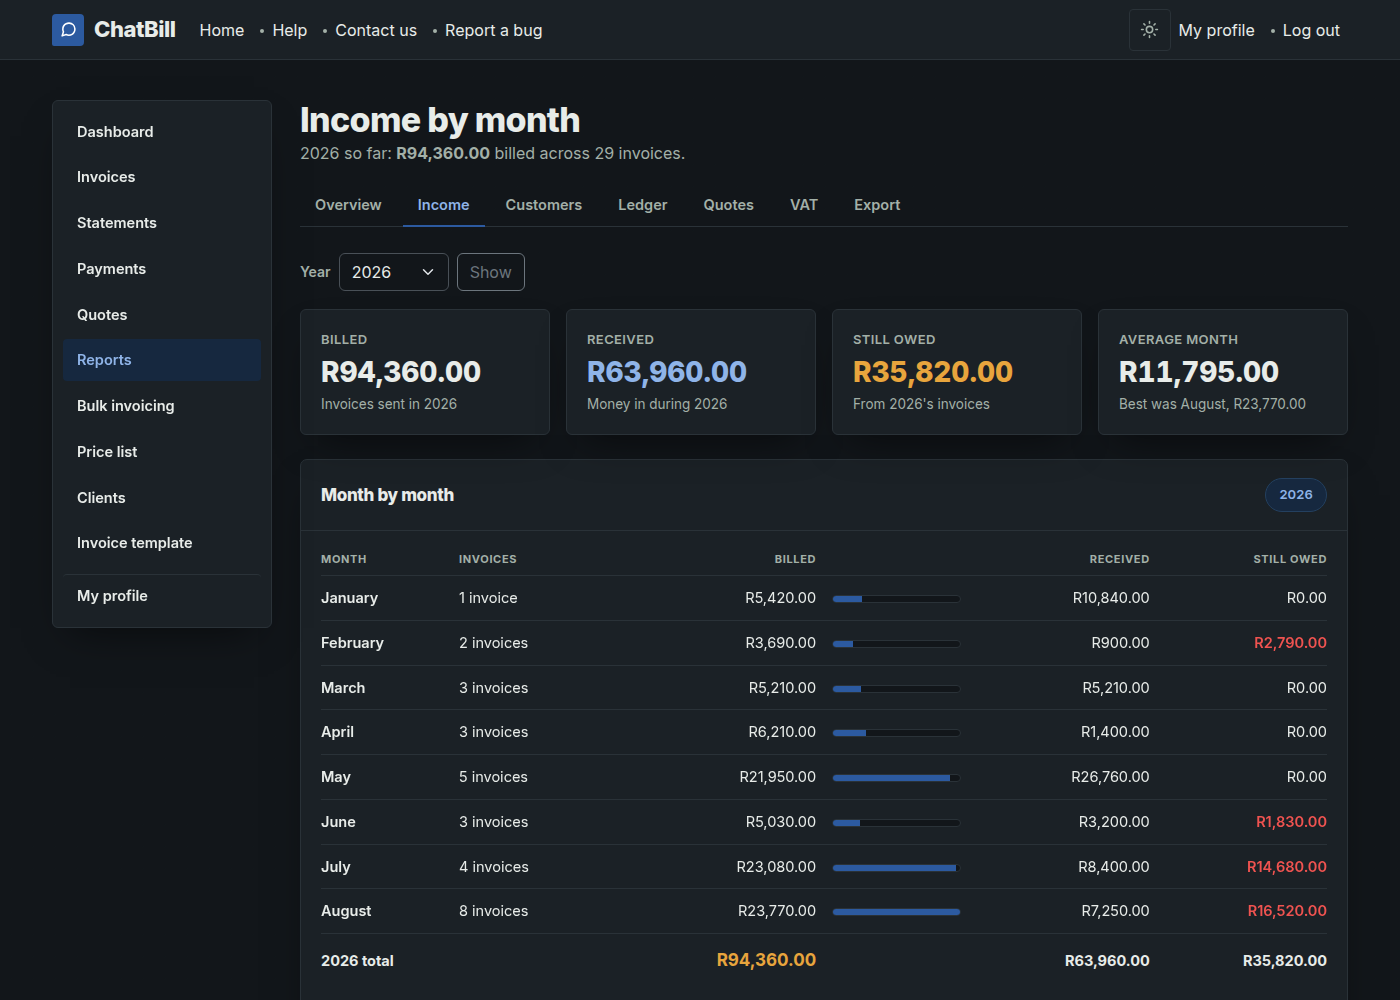
A row per month: how many invoices went out, what they came to, what was paid, and what's still outstanding from that month's work. The tiles above it give the year's totals and your average month, with your best month named underneath.
Billed counts an invoice in the month you raised it. Received counts it in the month the money actually landed, so an invoice you sent in June and got paid for in July shows up under June in one column and July in the other. That's deliberate: it's the difference between what you've earned and what you've been paid, and both are worth knowing.
-
3. Best customers
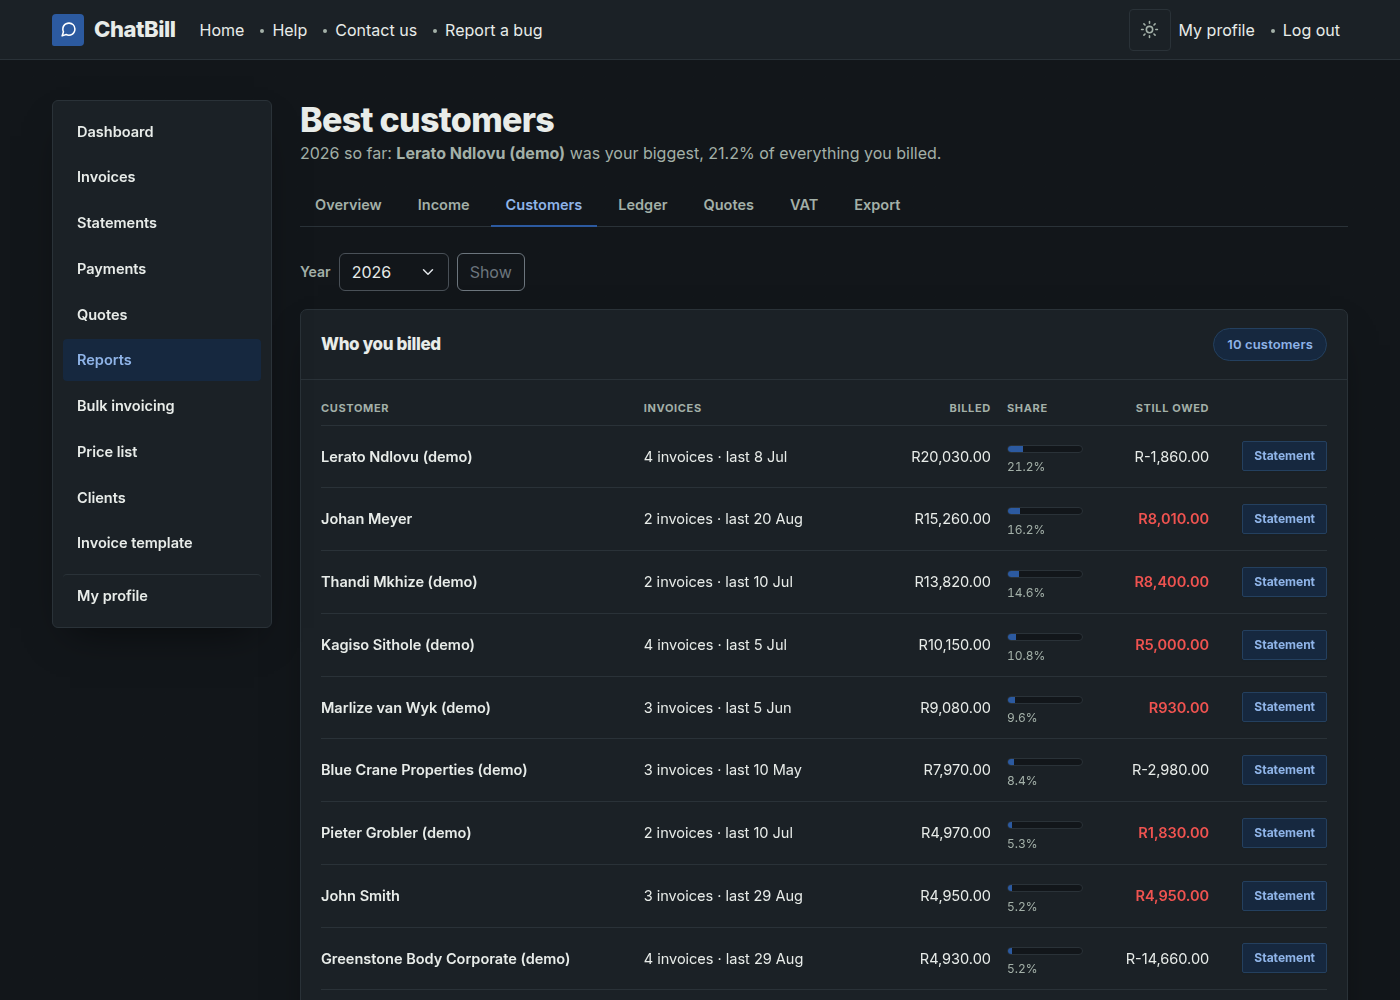
Everyone you invoiced during the year, biggest first, with how many invoices each of them got, what they've paid, what they still owe, and what share of your year they were. Useful for knowing who's worth keeping happy, and who's quietly become half your income.
Customers are matched on the cellphone number you billed, so the same person spelt two different ways still counts once. If someone owes you money, their statement is where you chase it.
-
4. Quotes won and lost
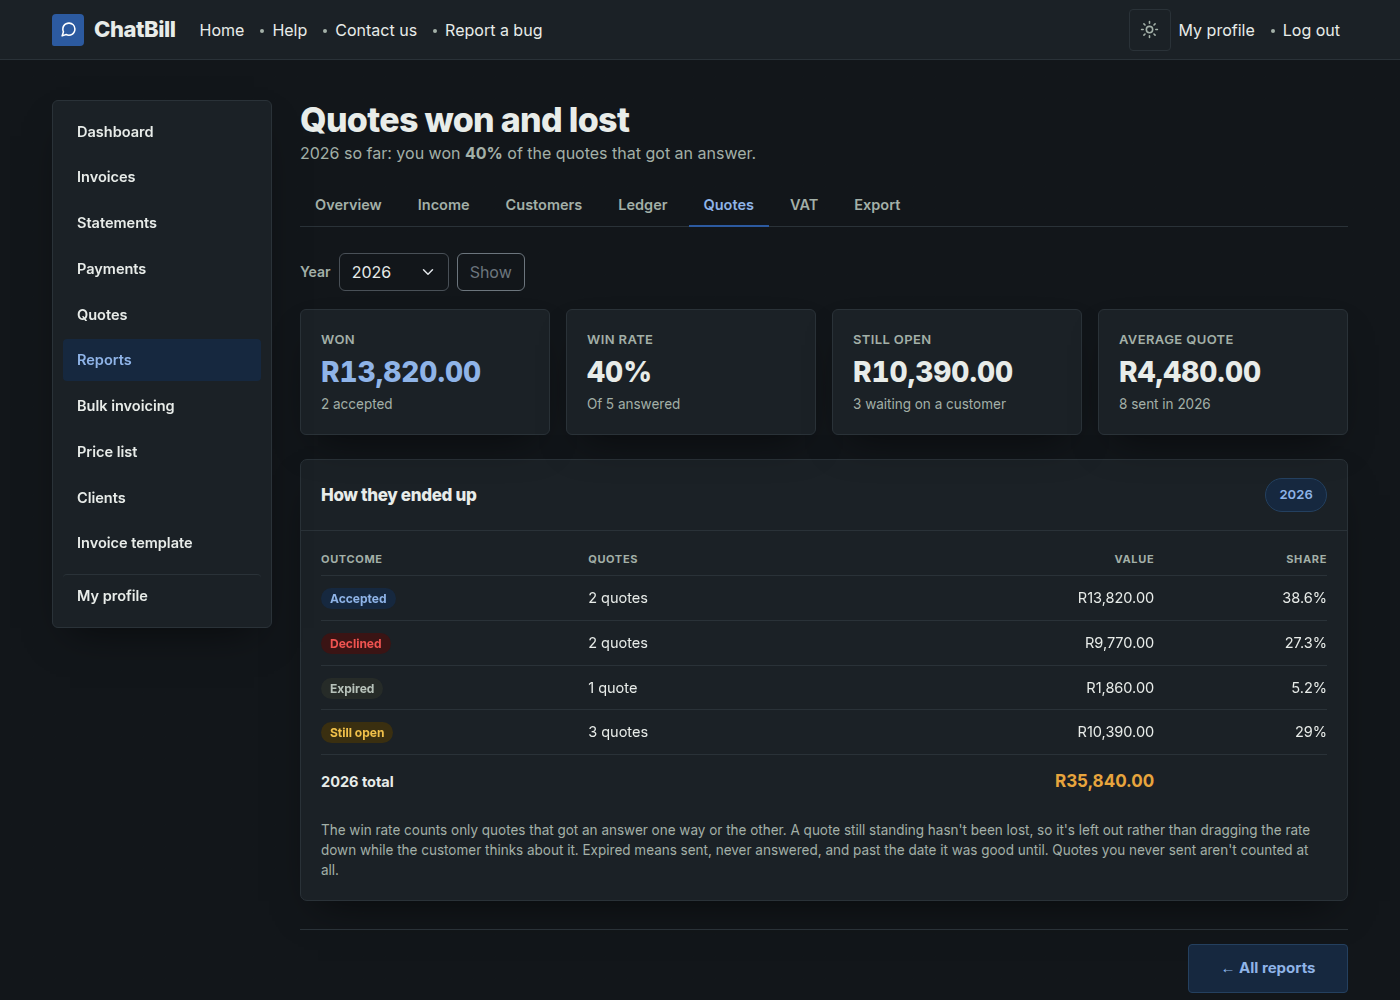
What happened to the quotes you sent: won, lost, still waiting, and the ones that expired without an answer. The win rate only counts quotes that actually got an answer, so a pile of quotes nobody has replied to yet doesn't make your figure look bad.
Worth checking Accepted but not invoiced now and then. That's work the customer said yes to that you never billed for, which is the most expensive thing on this page.
-
5. VAT
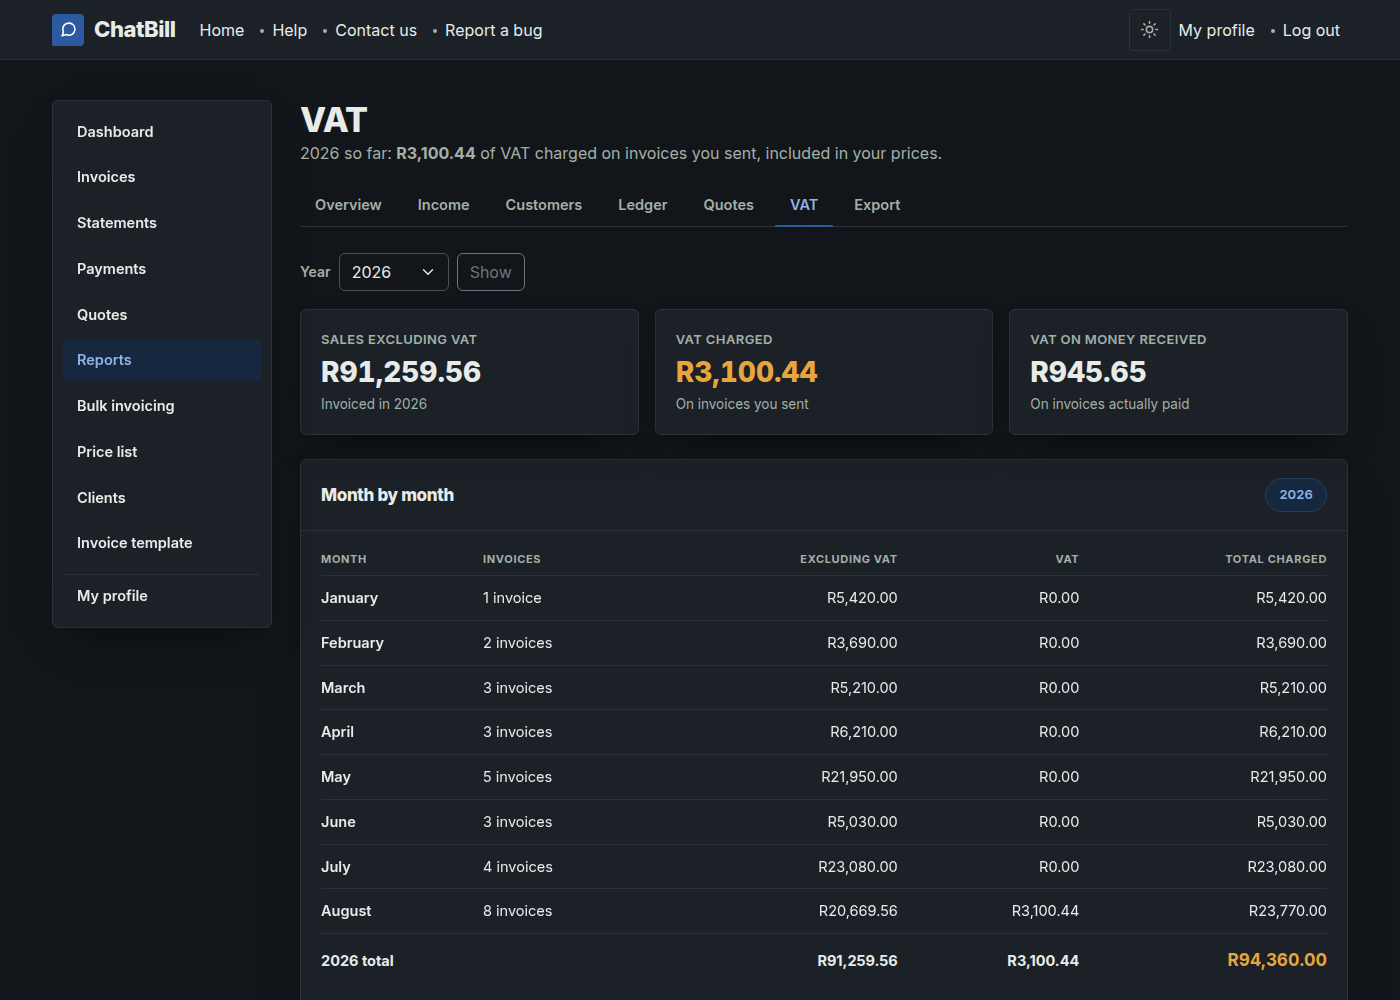
Month by month: your sales excluding VAT, the VAT you charged on them, and the total your customers were billed. The figures come straight off the invoices as they were sent, so this page always agrees with the documents your customers are holding.
There's also a figure for the VAT on invoices that were actually paid during the year, for anyone accounting on the payments basis rather than the invoice basis. If you're not VAT registered the page says so and there's nothing to read. What the inclusive and exclusive settings mean is its own guide: VAT pricing.
-
What the reports leave out
Draft and cancelled invoices are never counted. A draft was never given to a customer and a cancelled invoice was taken back, so neither one is money you billed. Quotes count from the day you raise one, since a quote is made to be sent.
If you want these figures in a spreadsheet, or you need to hand the year to a bookkeeper, that's the export guide.